
The 7 Best Trading Indicators – That Actually Work
Trading indicators are oftentimes a big topic in the trading industry.
Some people love them as they help them guide through the financial markets and looking for setups.
But some are strongly against them as they label them as tools for “retail” traders that lag and don’t work.
In this article, we will have a look at some trading indicators that actually work.
Because I won’t be covering the basic indicators such as moving averages or RSI.
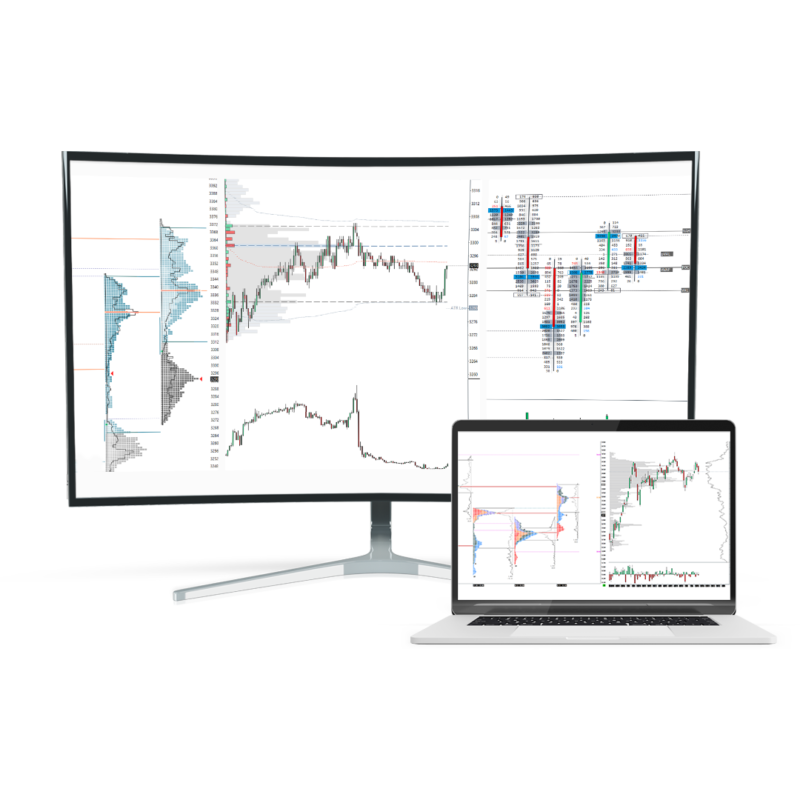
You need to use some of the more advanced trading platforms to be able to trade with these technical indicators.
I will explain the fundamental basics behind these indicators and provide you with actionable tips.
But bear in mind that these indicators are still just tools that should be helping you in your decision making, not a standalone trading system by themselves.
If you like this article, read the rest of the blog or join the Tradingriot Bootcamp for a comprehensive video course, access to private discord and regular updates.
For those who are looking for a new place for trading crypto, make sure to check out Woo. If you register using this link and open your first trade, you will get a Tier 1 fee upgrade for the first 30 days, and we will split commissions 50/50, which means you will get 20% of all your commissions back for a lifetime. On top of that, you will receive a 20% discount for Tradingriot Bootcamp and 100% free access to Tradingriot Blueprint.
You can either read the article or watch video version below.
Table of Contents
What are trading indicators?
In essence, I qualify as an indicator of everything behind the price action that helps you with your decision-making while trading.
If we take a look at a simple price chart, the only thing you see is the Japanese candlesticks or bars.
Everything on top of that is an indicator.
Some of these are based on price action itself, and most of them are based on some average from previous data points.
Do trading indicators work?
When you think about technical indicators, the first thing that might come up to your head is moving averages, RSI, MACD, or Ichimoku cloud.
Most traders that are trading for a while and think they know everything about trading will tell you that these are useless and you should not be using them in your trading at all because they just lag behind the price.
The truth is that there is no right or wrong way to trade.
And although indicators I will try to show you more sophisticated and unknown indicators than classic moving averages, I wouldn’t throw these MAs away.
There is no right or wrong in trading and there can be days where experienced DOM traders can be outperformed by traders who use simple moving average crossover in their trading.
On the other hand, these more basic technical indicators tend to give more false or not working signals and they are very dependant on the trading environments the market is currently in.
In trending markets, RSI can be overbought or oversold for days or weeks before markets reverse, but it can work great in a bracketing market where you simply fade and extremes of a range.
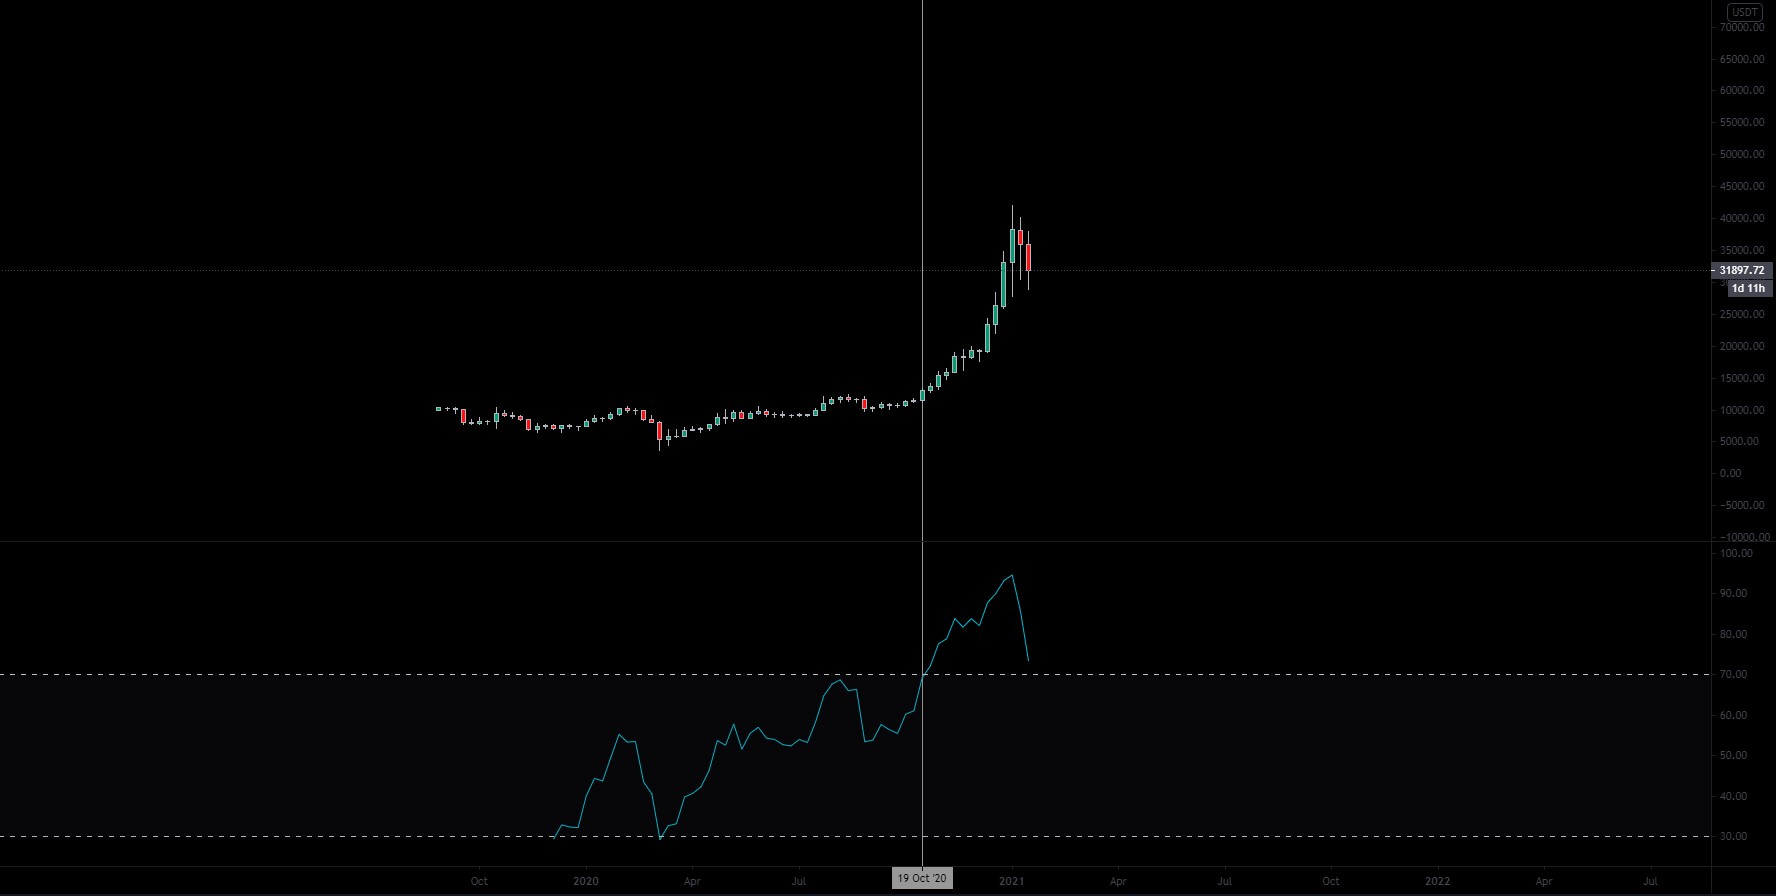
As you can see RSI on Bitcoin got overbought on the 19th of October 2020.
At that time price was around $12,000. If you started shorting Bitcoin based on an overbought RSI indicator, you would set yourself up for a very painful ride.
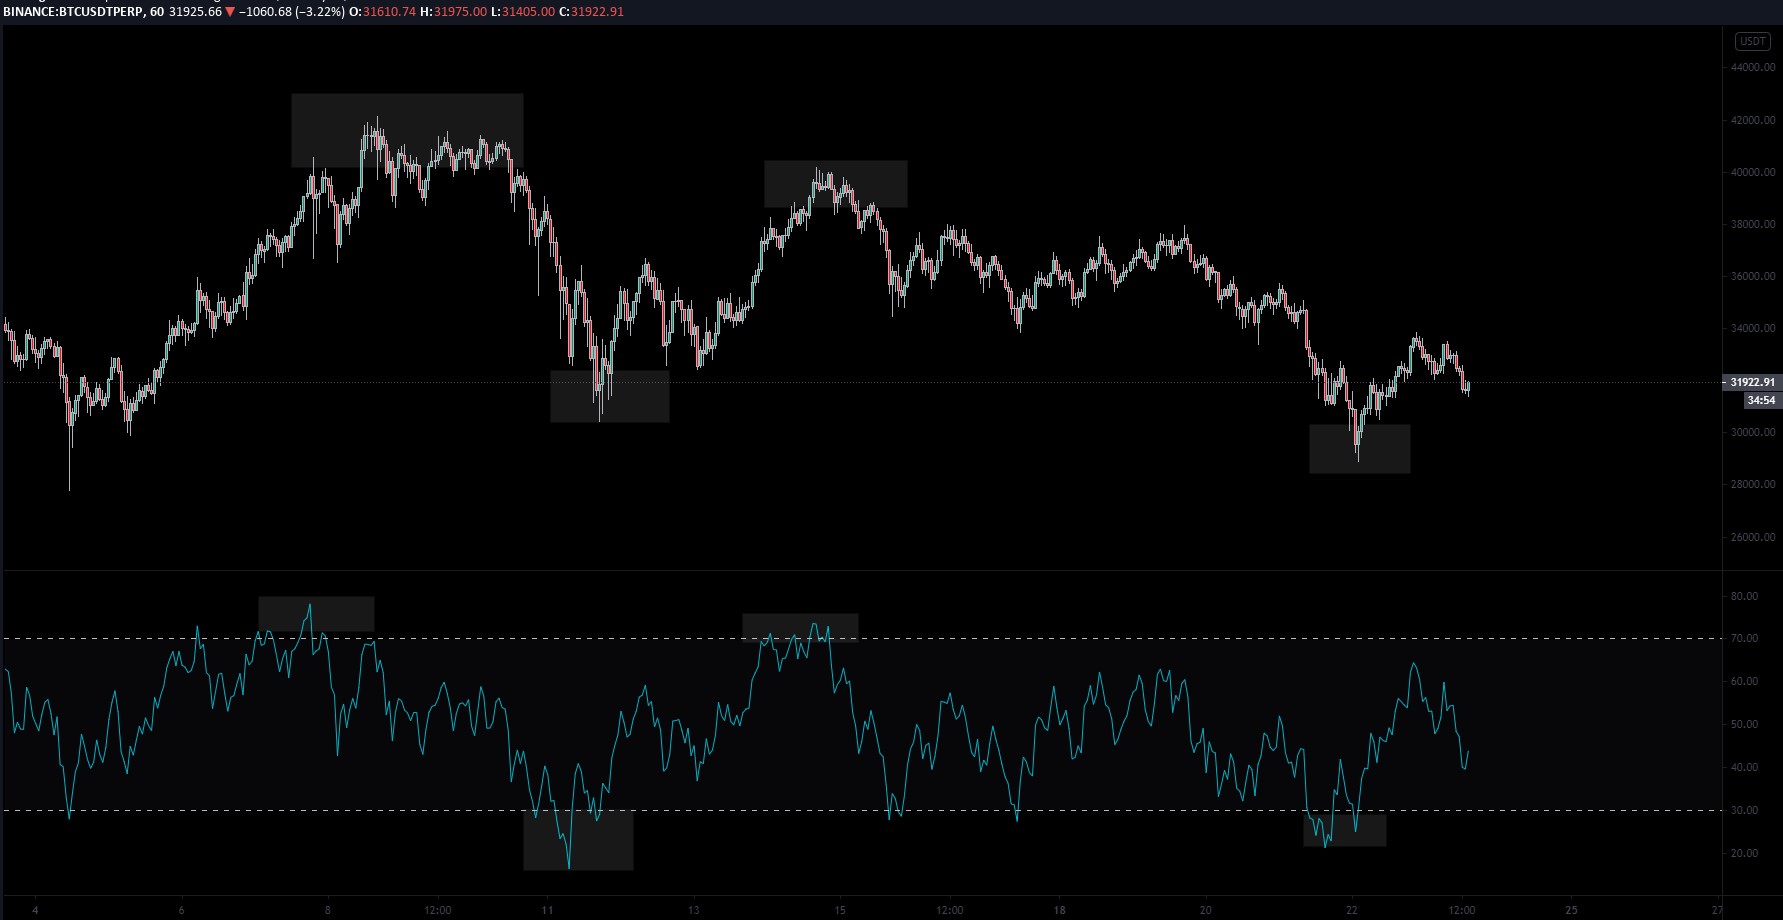
But if we change a timeframe and look at intraweek timeframe where Bitcoin stayed more so in range, using RSI to fade extremes would bring decent results.
On the other hand, something like moving average can be an excellent technical indicator to use in strong trends but will provide you false signals in ranges.
Markets are constantly changing and shifting environments throughout the timeframes, because of that you should always be mindful of what is going on before you start to get affected by technical indicators.
Cumulative Volume Delta – CVD
At the first sight, the cumulative volume delta looks similar to any other oscillator like previously mentioned RSI, or Macd, Stochastics, etc.
But compared to these classic oscillators, cumulative volume delta represent something completely different.
To understand it properly, you need a little deeper understanding of orderflow in trading, which I previously covered in this article.
A delta represents finalized executions at the bid and the offer.
There are several ways how to incorporate Delta in your trading with Cumulative Volume Delta (CVD) being the easiest one for beginning traders. The other methods are described in the Trading Blueprint.
Compared to classic oscillator you are not looking at overbought/oversold conditions but only at divergences.
In healthy trends, delta (market orders) should go hand in hand with limit orders.
Once this breaks we can start looking for either absorption or lack of participation.
Both of these should raise a red flag and you should start paying attention to the opportunity to either fade the move or exit your position.
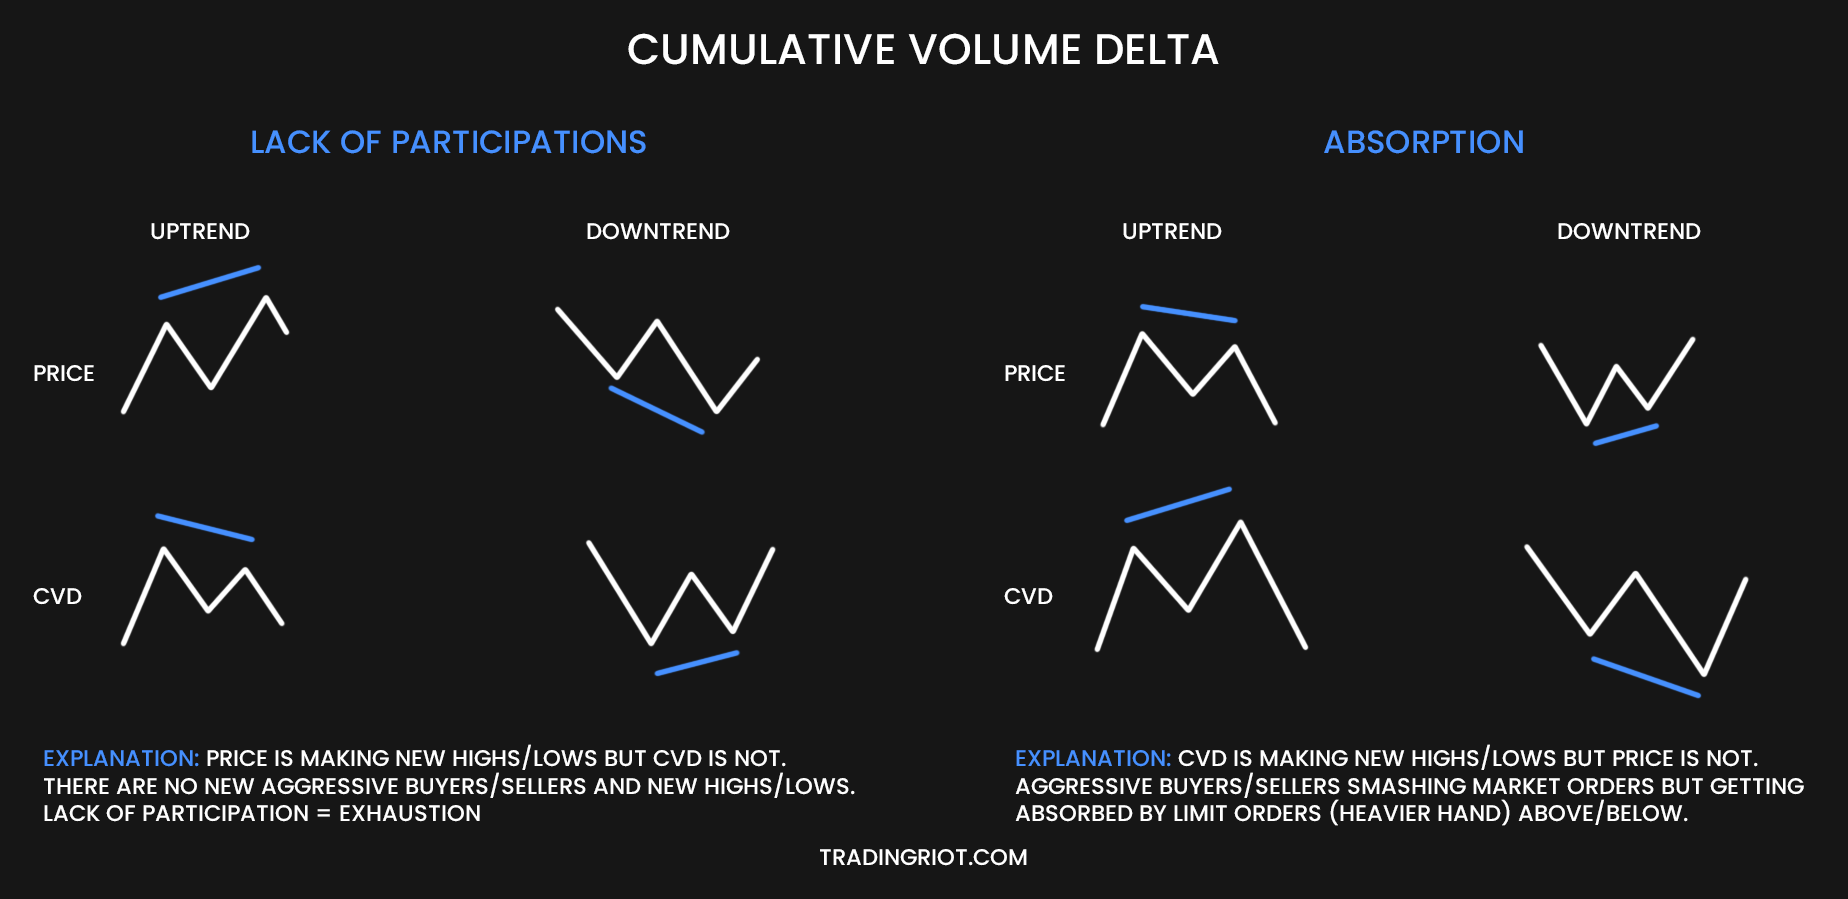
As represented in the picture above, there are two types of divergences you want to look for. Lack of participation (exhaustion) and absorption.
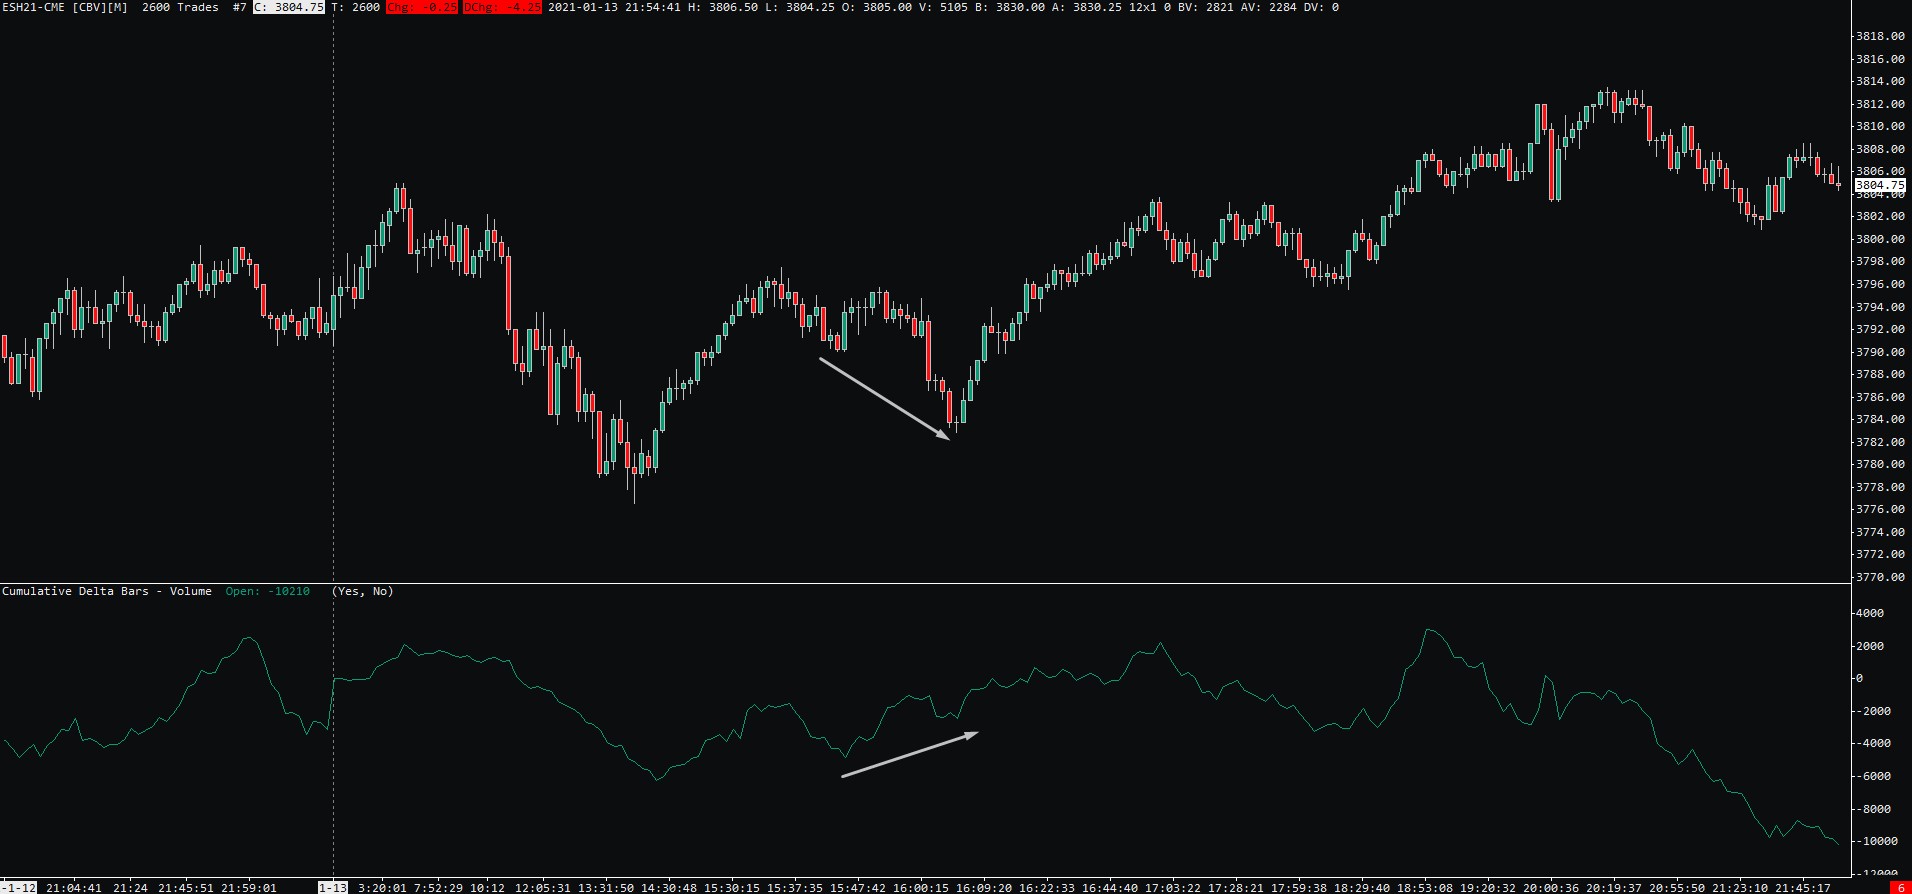
Lack of participation happens when price makes new high/low but cumulative delta does not.
This shows us that there is no interest from aggressive buyers/sellers at new highs/lows.
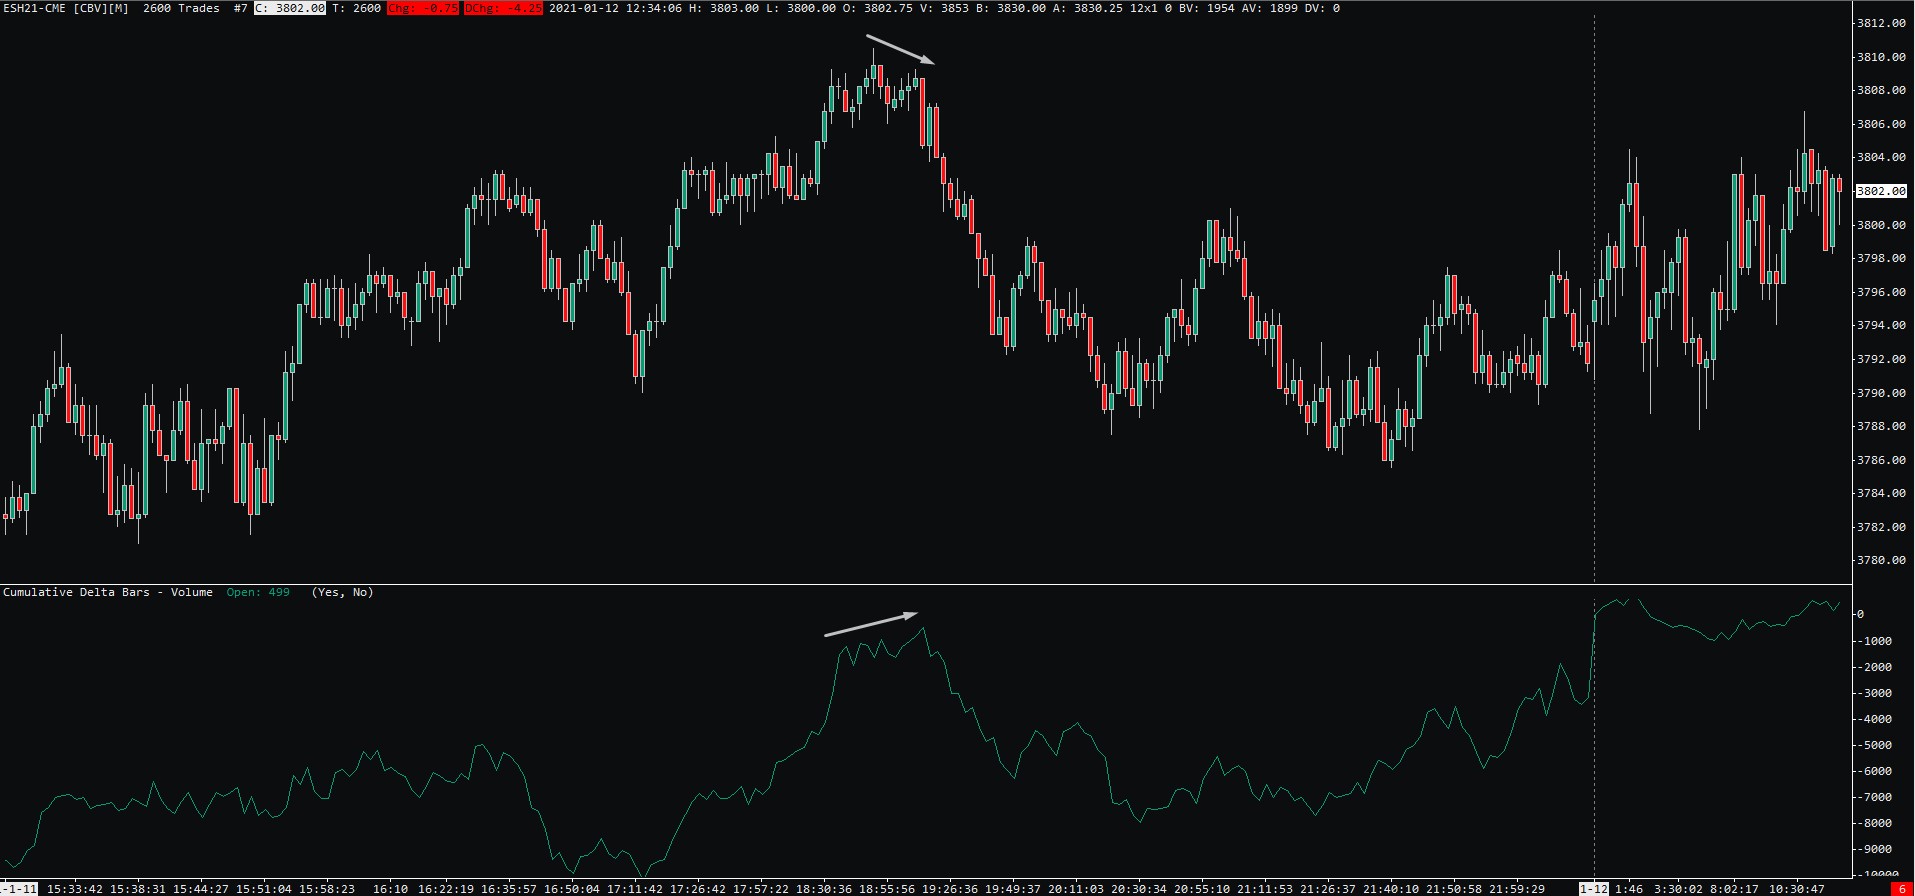
The second one is absorption.
This is the exact opposite and it happens when CVD runs to a new high/low but the price doesn’t.
It tells us that aggressive buyers/sellers are getting too excited but their attempt is absorbed by limit orders that are heavier hand in this case.
Open Interest Indicator
Another very useful oscillator type indicator is an Open Interest indicator.
Although it is quite complicated to get any useful reading from legacy markets, if you are trading cryptocurrencies there is an Open Indicator built right in Exocharts.
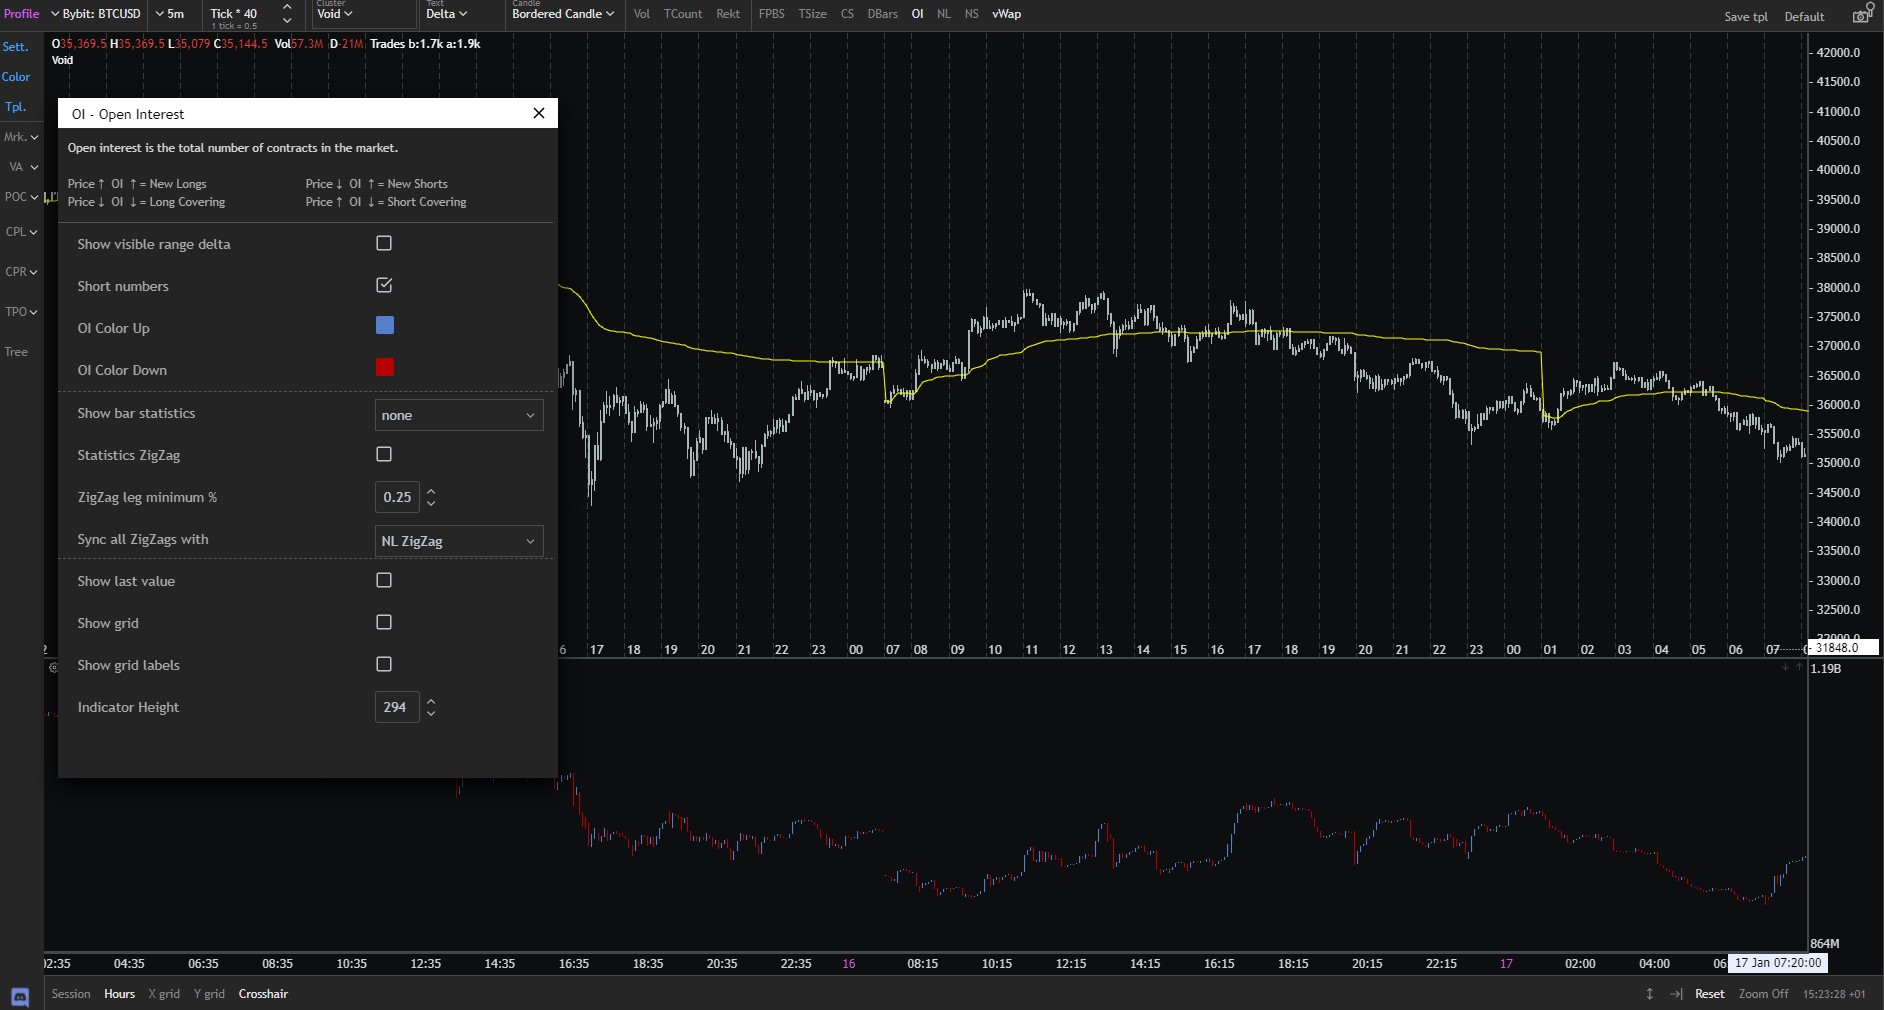
The open interest represents the total number of contracts currently opened in the market.
When the price is going either up or down with OI increasing, it can be considered a healthy move.
If the price is not supported by increasing OI we have a Longs/Short covering.
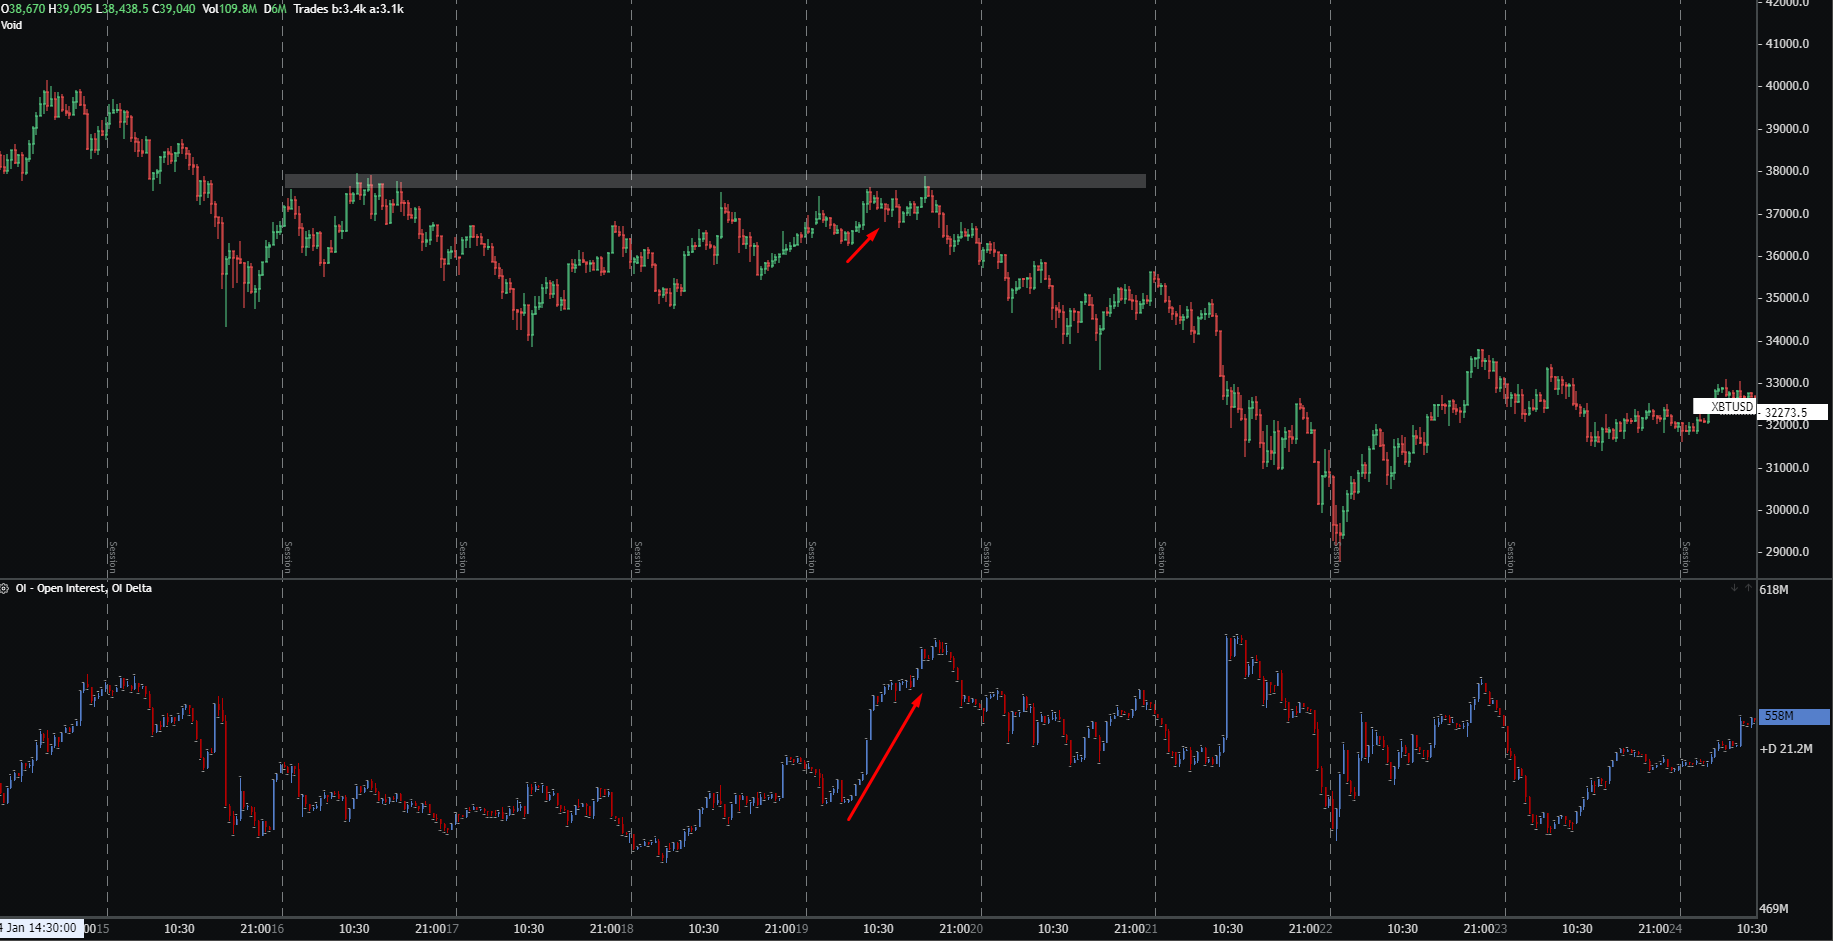
Compared to cumulative volume delta, you are not looking so much for divergences, but validations of current movements and what is going on in the overall context.
As you can see in the example above, there was a large increase in Open interest, yet the price did not move up and ended up in resistance.
This shows us large volumes rushing into resistance yet price barely moving, in other words, this is an example of absorption.
There is no reason to try to debunk every price move and try to figure out what other participants are doing, especially in crypto where orderflow is fragmented through several exchanges.
But using indicators such as Open Interest or Cumulative Volume Delta can give you a very quick heads up on what is going on.
Volume weighted average price – VWAP
Volume weighted average price (VWAP) is a very popular indicator which a lot of different options.
It has been covered in-depth in this article.
In essence, VWAP is just any other moving average but puts a Volume into the calculation.
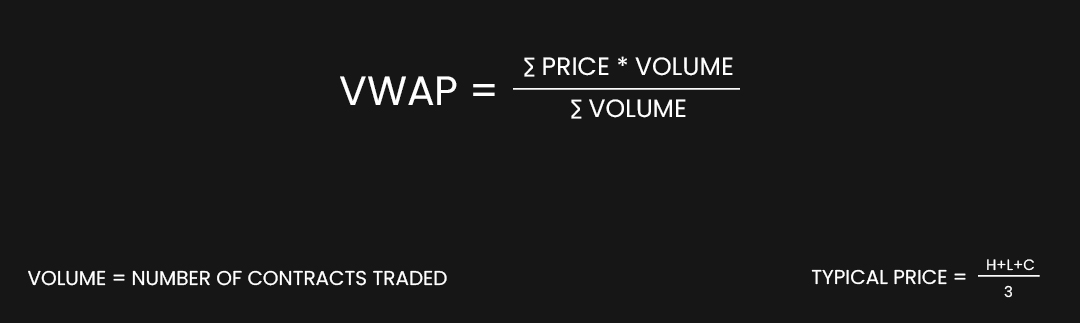
You can use it both for trend-following and mean reversion by adding standard deviation bands.
VWAP is not a complicated indicator to use and there is no magic behind it, but with a variety of options and the fact that volume is implemented into the calculation, it is a great indicator to have in your toolkit.
In my trading, I always keep an eye on how the market is trading in relation to daily, weekly and monthly VWAP and look for possible reversals once it reaches the standard deviation.
If you are interested in how exactly I enter those trades, you can check out the Trading Blueprint.
Pivot Points
Pivot points are pretty much part of every trading software.
Although a lot of traders instantly disregard them as their think their way of marking out horizontal support and resistance is much better.
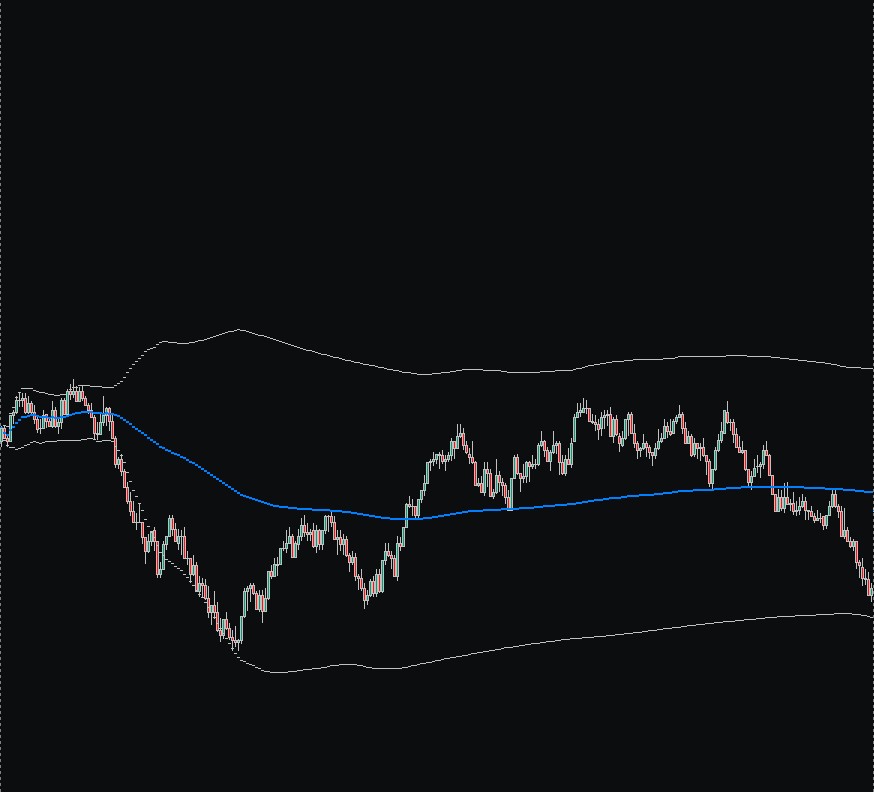
If you look at how Pivot Points are calculated you will find out quite an interesting formula.
Pivot Point Calculation
Pivot point (PP) = (High + Low + Close) / 3
First resistance (R1) = (2 x PP) – Low
First support (S1) = (2 x PP) – High
Second resistance (R2) = PP + (High – Low)
Second support (S2) = PP – (High – Low)
Third resistance (R3) = High + 2(PP – Low)
Third support (S3) = Low – 2(High – PP)
Pivot points are extremely straight forward, they plot horizontal support and resistance on your chart.
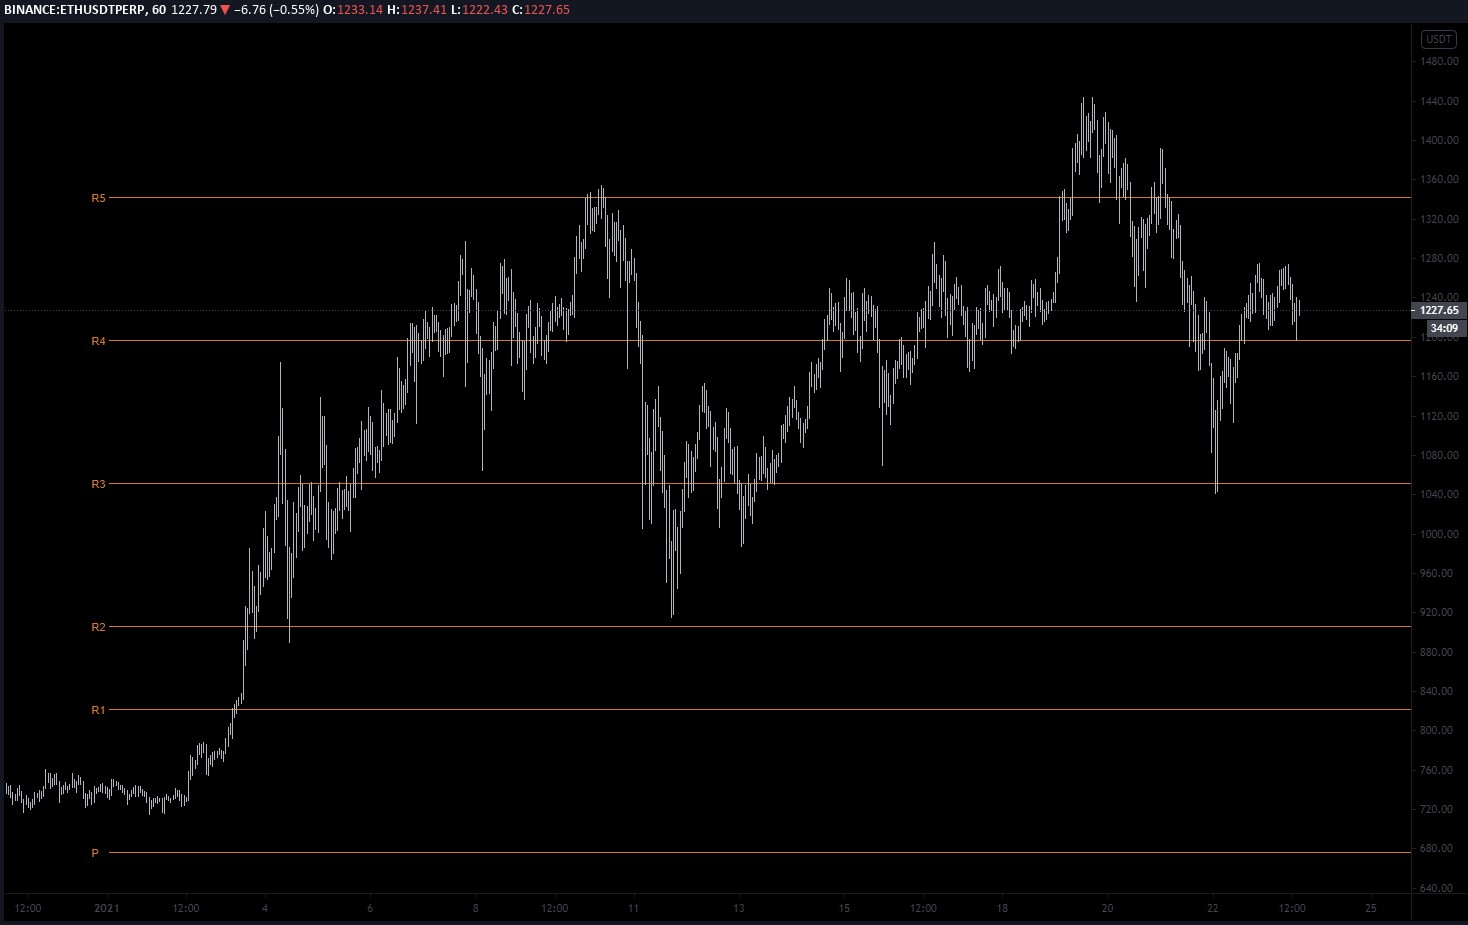
In general, higher timeframe pivot points like Weekly, Monthly, or Yearly pivot points work much better compared to daily or hourly pivots.
If you add these to your charts, you should take them what they are, automated support and resistance levels.
That means they will hardly be perfect.
On the other hand, they can work like great confluence when building your trading ideas.
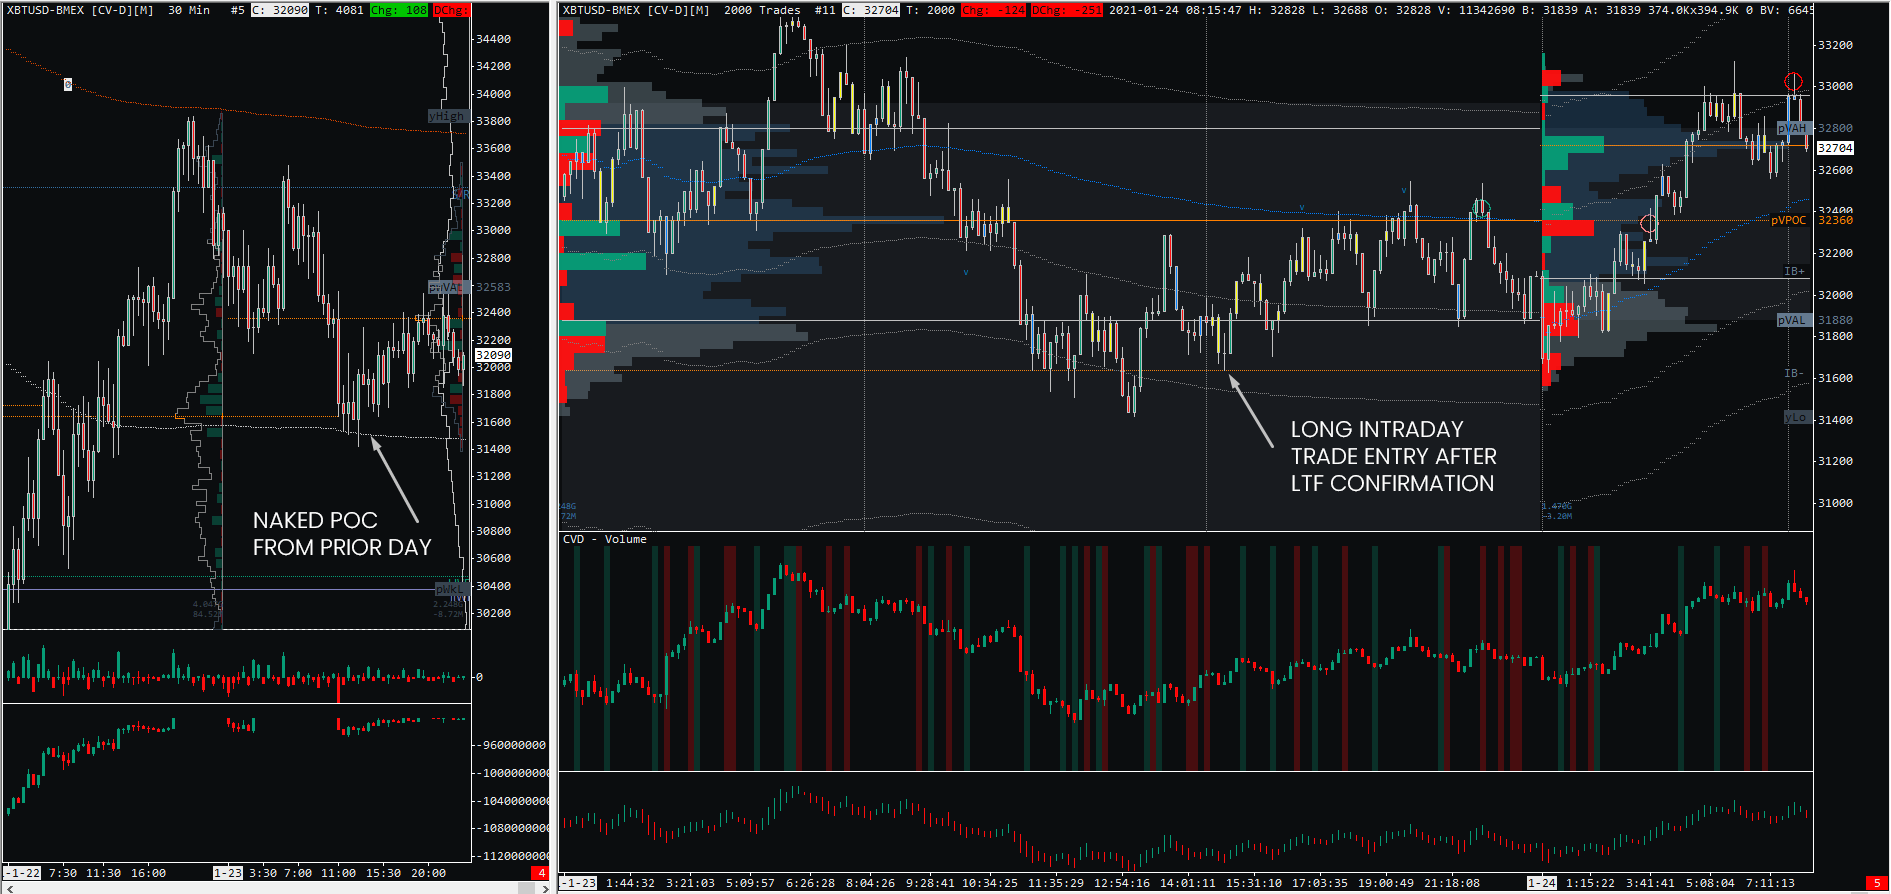
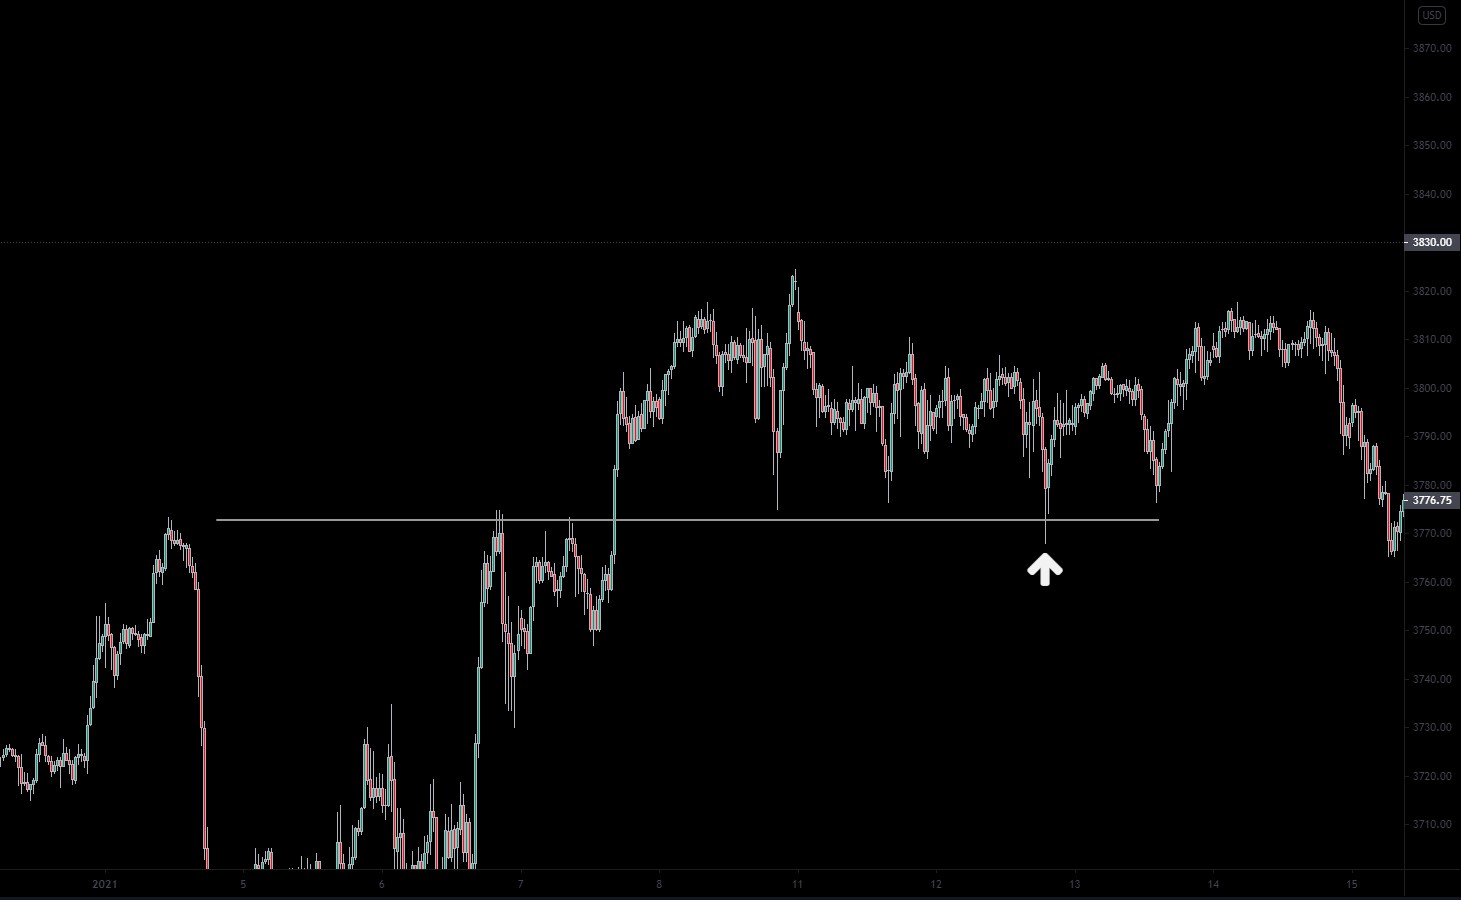
Naked Points of Control
Speaking of automated support and resistance areas, the Naked Points of Control can be very easily plotted to your chart and used as a line in the sand which oftentimes gets a reaction once reached.
Points of control are part of trading with Volume profile, so if you want to utilize this tool properly you should have a deeper understanding of why they exist in the first place.
In short, Naked points of control are price points with the most traded volume during a given trading day/week, etc.
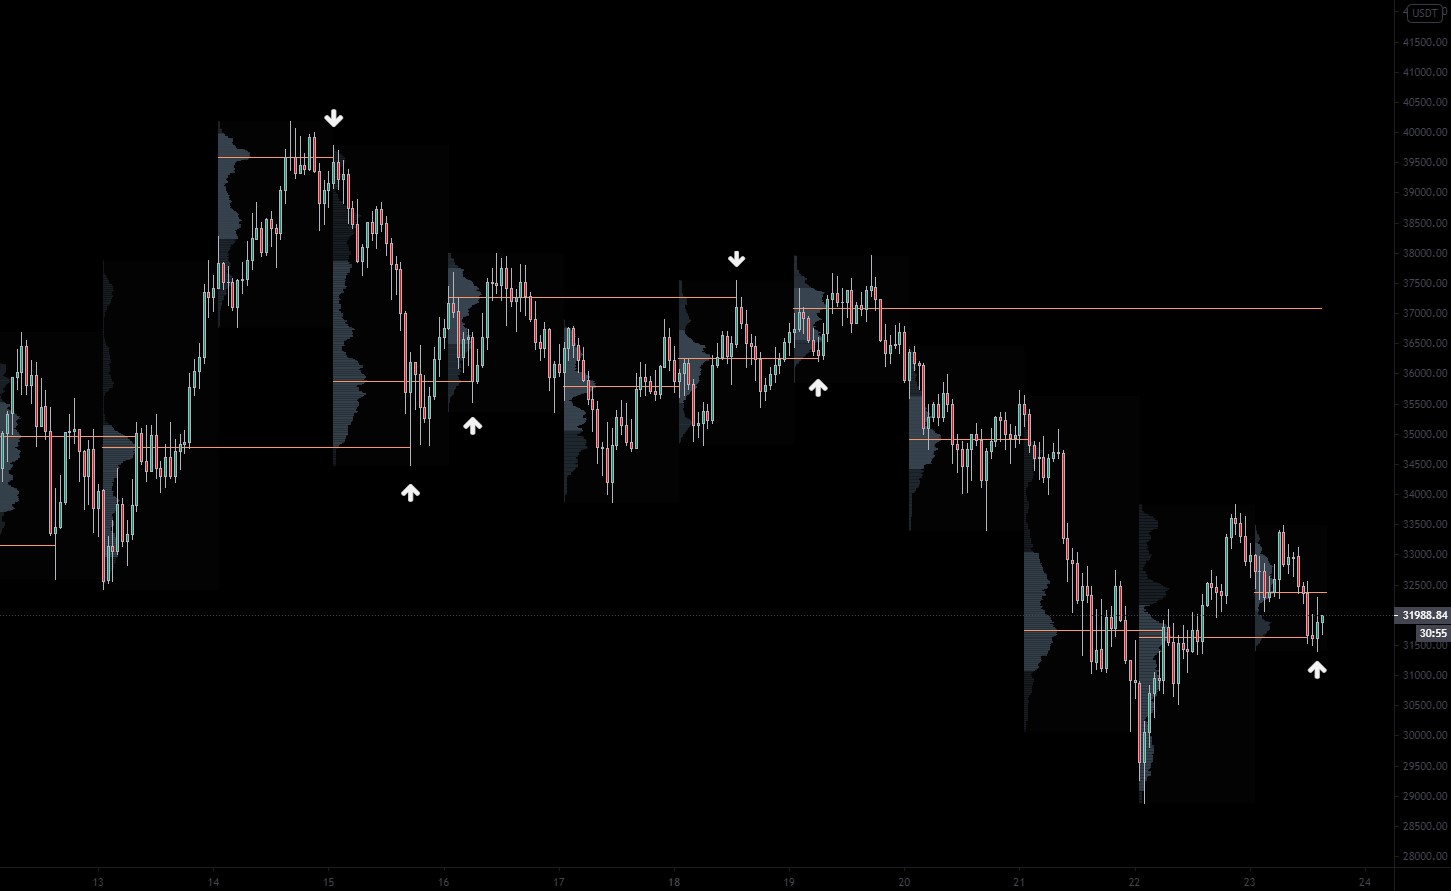
I prefer fading these with my day trading strategy.
Once price tests the naked point of control from the prior day, you can look for confirmation on lower timeframes and entering the market.
Naked points of control and pivot points are very straight forward indicators with the low effort of plotting on your chart.
Don’t expect them to be perfect, but once you start to monitor them, you will see that reactions happen more often than not.
And as I already mentioned, they are one of my favorite lines in the sand during every trading day.
Opening range and Initial Balance
Opening range and initial balance is not something you will find as an indicator in many trading platforms.
On the other hand, they are ranges that happen at some time during the day, therefore can be easily plotted to your chart and you can implement them easily to your trading strategy.
The initial Balance comes from trading with the Market profile and it represents the first hour of regular trading hours.
This time differs on the instrument of your choice.
In Bitcoin, the Initial Balance is the first hour at daily open which is at Midnight GMT.
CME indices like E-mini S&P500 or Nasdaq have an Initial balance in the first hour after open at 9:30 am EST.
Eurex products like Dax, Stoxx, or Bund have their initial balance first hour after open at 8:00 am CET.
The opening range comes from trading pits and it usually represents the first 1-minute of cash hours.
You might find other settings on the internet so it is not unusual to see someone using the first 30-seconds or the first 5-minutes.
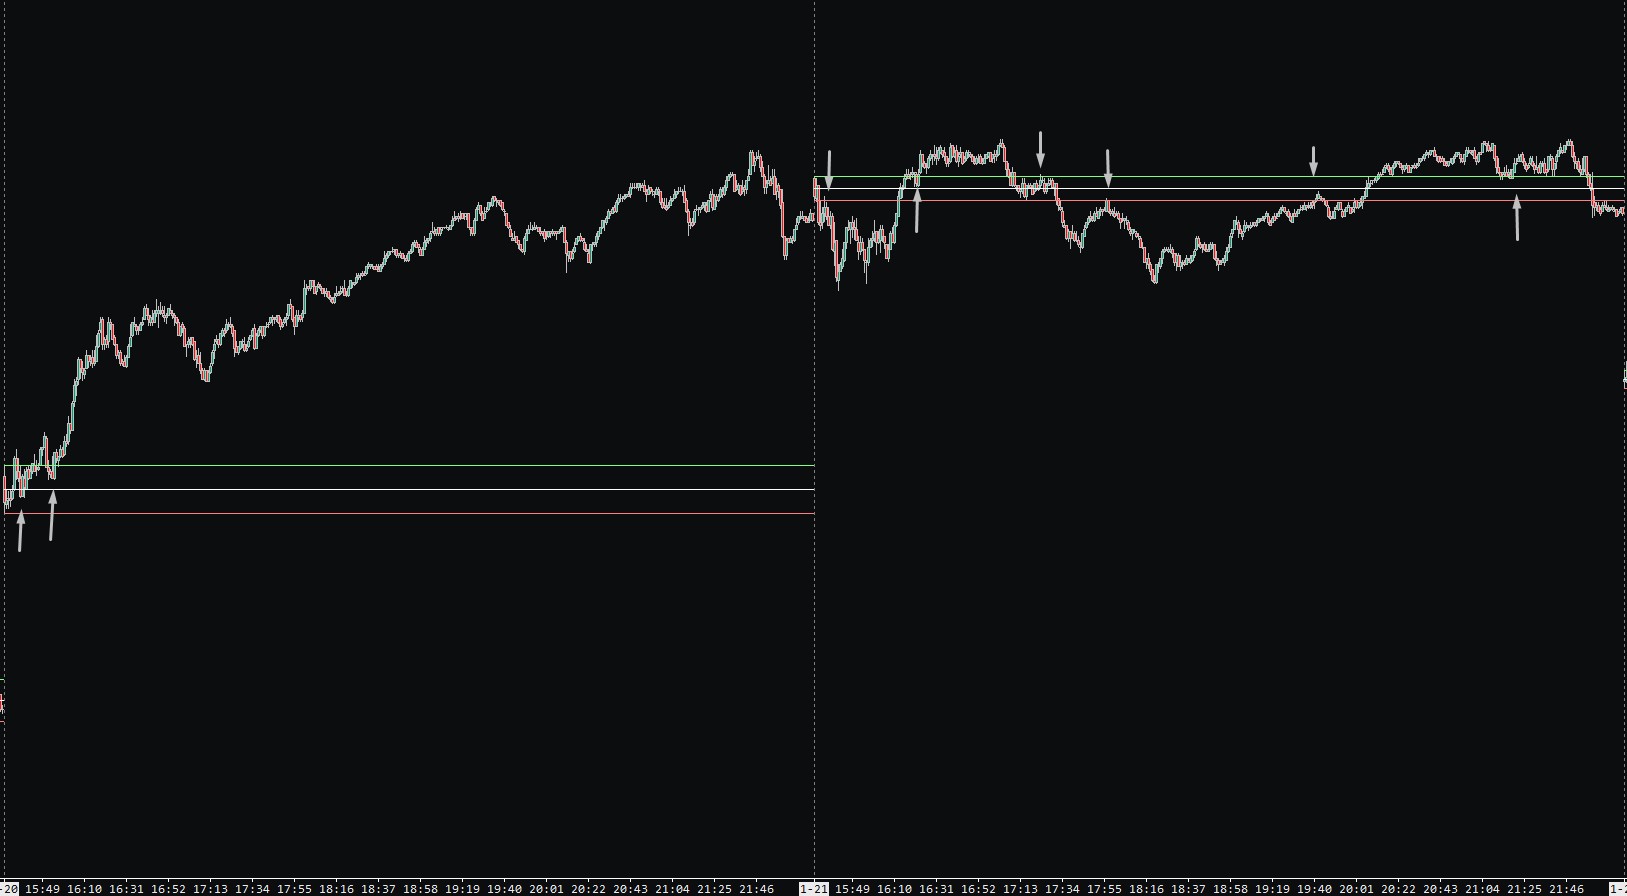
As you can see on the chart above, this is the opening range represented of the first 1-minute of RTH session on E-mini S&P500.
These easily plotted levels can be used through the trading day as support and resistance.
Matter the fact there are several traders who were able to build whole trading strategies on trading the opening range.
The most famous one being Pax, you can have a look at this interview with Anthony Crudele where he breaks down his opening range trading strategy.
If you are trading breakouts from the Initial balance or opening range you are hoping to capture the trend days where the price will just rally straight from the open.
This might not happen often so your strike rate will be below average, but from time to time you will be able to capture a great runner.
If you are able to incorporate solid risk management, you can have a long term profitable edge which is very easy to execute.
In my trading, I don’t trade these as blind levels but use them for confluence.
Large size trackers
In recent years any sophisticated trading platforms that offer a variety of orderflow tools added their own indicator that allows you to show graphical visualization of large executed orders.
They are always called a little different so if you are using Sierra Chart look for Large Volume Trade Indicators.
If you are an Exocharts user, there is an indicator called Rekt.
And in Quantower it is called Power Trades.
They are always called different but they show the same thing, executed orders filtered by size.
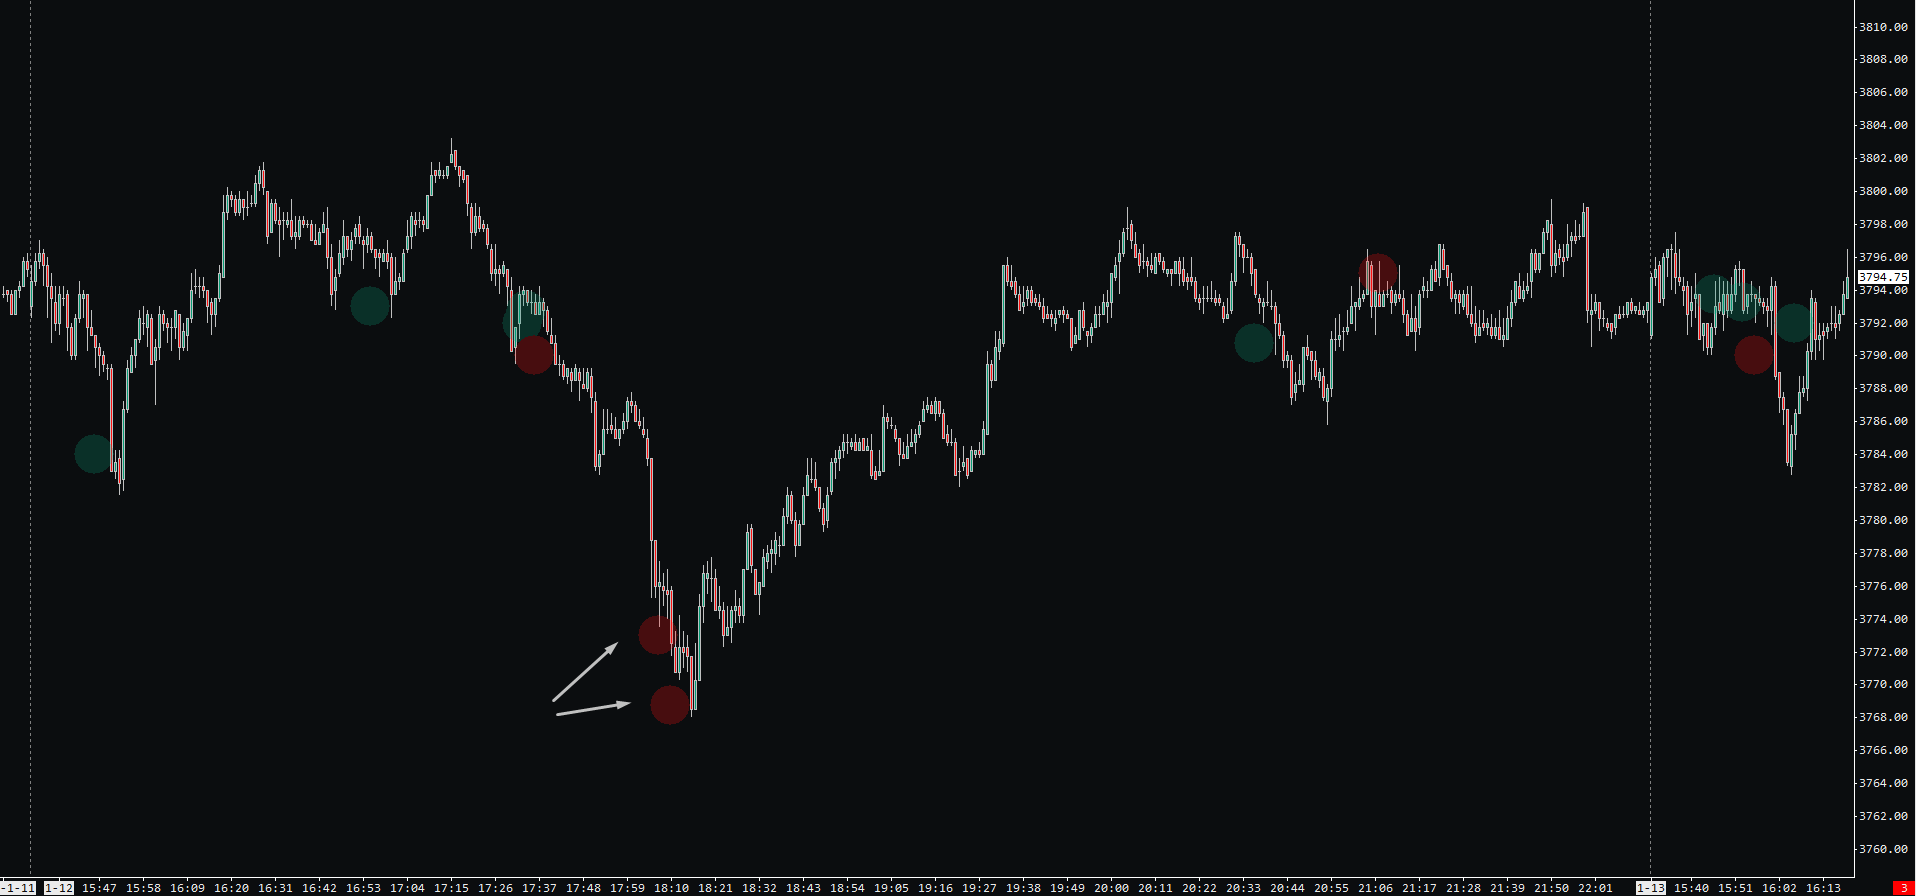
As you can see on this E-mini S&P500 chart, there were large sell orders executed at the bottom of the sharp selloff.
These can signal both stop-orders from longs or breakout short traders trying to push lower.
Either way, this is telling us one thing, that someone is getting too large, and once the price showed a lower timeframes signs of reversal, this level is prime for entry.
If you look at other dots in the chart above, you might start to think they happen in the most random place and you are not wrong.
We never 100% know the intention of other traders and that is why I always recommend everyone to pay attention to these only in the area of interest.
If we take a look at the same chart on the 30-minute timeframe we can see the market just tested the fresh level of SR after the false break below the double bottom.
Pure price action traders always assume these things to happen but with an indicator like this, you can be certain and you will find out that it will highly boost your confidence in your trading idea.
Conclusion
Trading indicators get more hate than they deserve.
It is mostly because people tend to look at few same ones that are included in every beginner trading book or course.
Truth is that the indicators I showed you in this article and many others can work as amazing tools for confluence in your trading.
Testovito
Thx for article.
Testovito
There is a question, “Large Size Trackers indicator”, is there a similar indicator with a different name, there is no such indicator on the steady resources?! THX